


(Image: 15th Street/City Hall station under Transit-Oriented Communities | BPN)
Center City District’s 2026 housing report is out this week, reviewing the last 18 months of L+I permitting data, along with Costar rent and vacancy data for a comprehensive look at the state of the downtown housing market.
As part of this year’s report, BPN produced a research memo about zoned capacity in Greater Center City and the impact of certain H.O.M.E. zoning reform initiatives using our BPN Property Intelligence data. We’re excited to share the full memo here and highlight some of the more interesting findings.
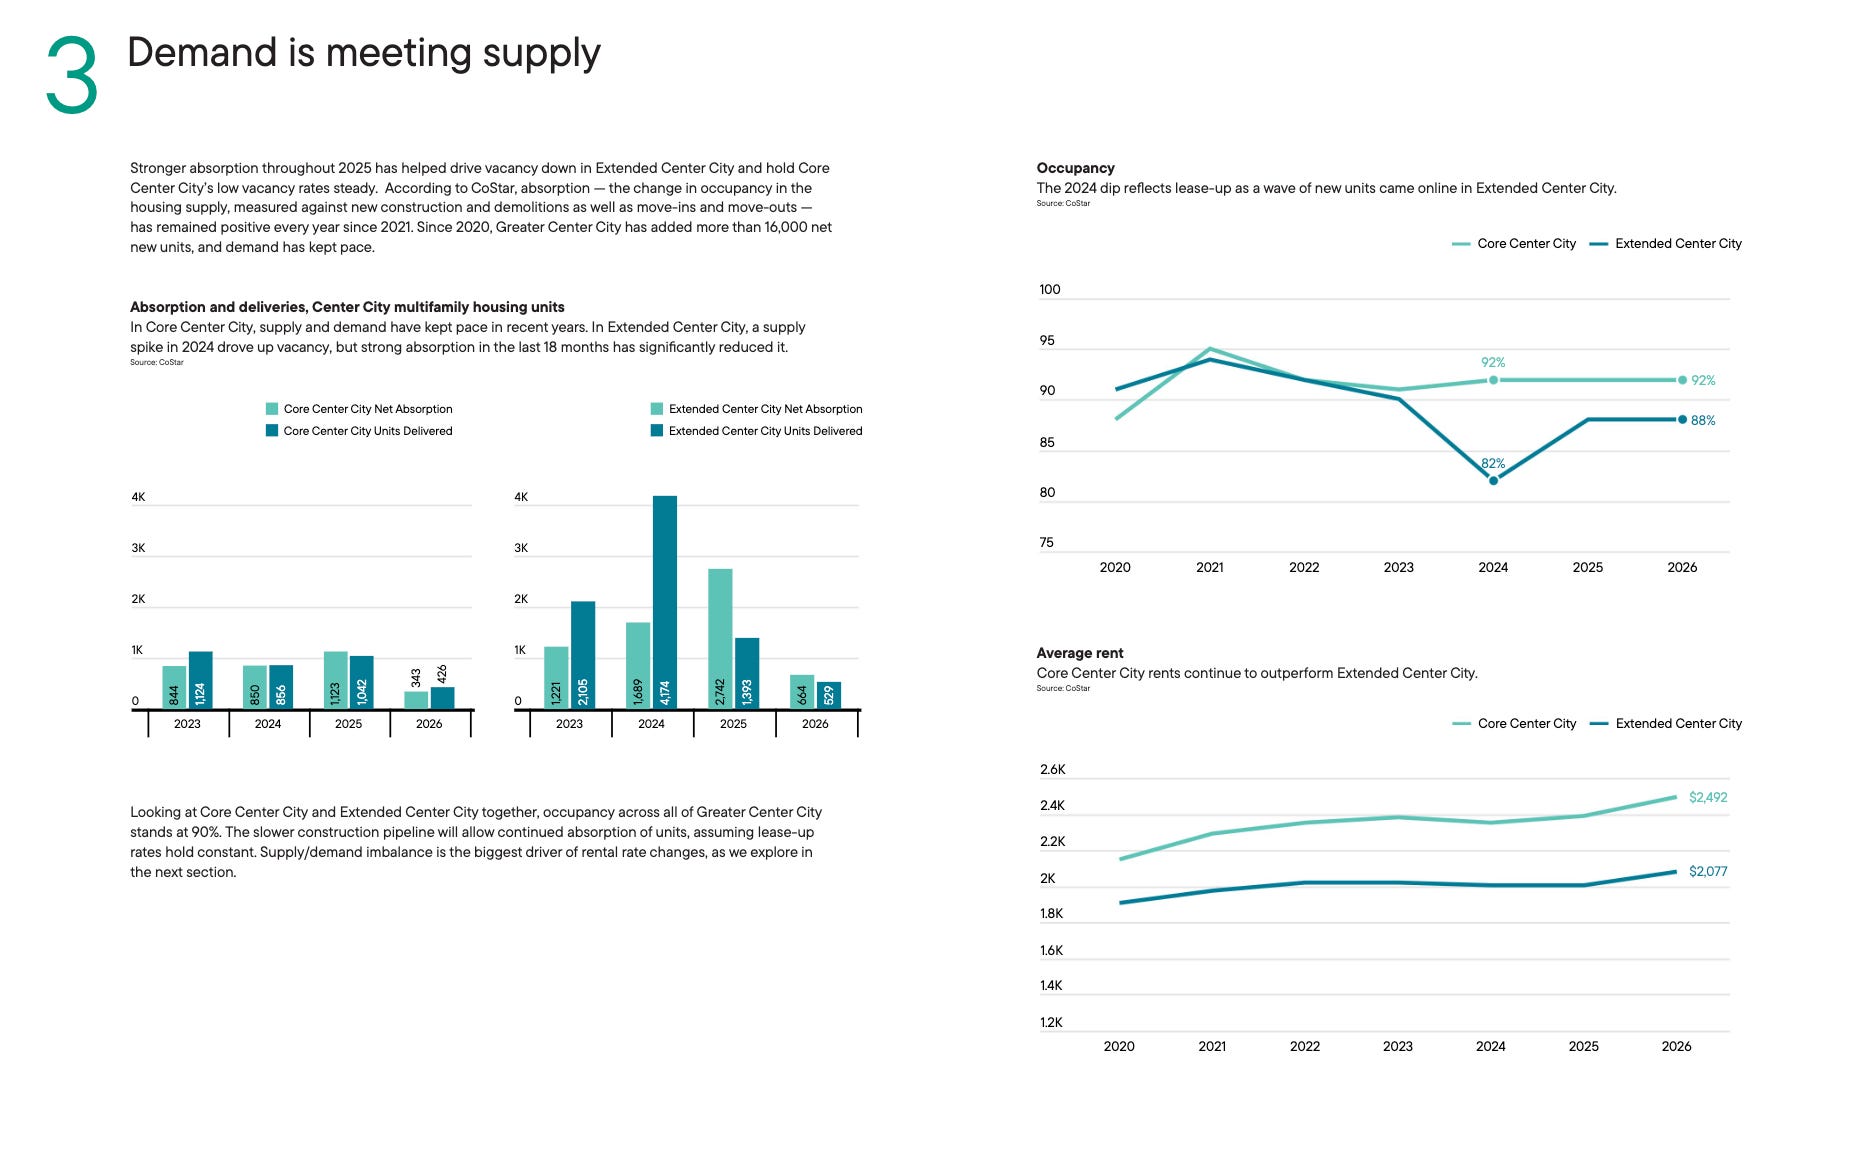
The importance of Center City to the citywide housing market cannot be overstated. CCD finds Center City is still Philadelphia’s housing construction engine, adding more than 40% of the city’s new housing supply since 2025 on just 6% of the city’s land area. What happens to housing supply there sets the pace for rent trends throughout the city and region.
Rent growth trends basically confirm YIMBY priors on the relationship between housing capacity and rents, with rent growth closely tracking absorption.
(Image: Center City Housing Report 2026 | Center City District)
BPN’s research looks at some of the questions around zoned capacity, namely: how much gas is left in the tank for Center City high-rise construction in terms of legal building capacity? And what is the expected impact of some of the H.O.M.E. initiative-related housing supply bills there?
The headline finding is that there’s still about 66 million square feet of unused zoned capacity in zoning districts CMX-4 and CMX-5—the two main high-rise categories—in core Center City.
It’s an overall positive finding suggesting there is still room to grow in the next real estate cycle, even without further action from city government to create even more capacity.
But there are a few reasons why the reality might be less rosy than the on-paper capacity numbers suggest.
Half the High-Rise Capacity in Core Center City is in Historic Districts
For starters, about 48% of the unused CMX-4 and CMX-5 capacity in core Center City is locked up in historic districts or on the local historic register. Beyond the two high-rise categories, about 57% of all soft-site parcels, representing around 42% of total unused soft-site capacity in core Center City, are located in historic districts.
Zooming out to Greater Center City, only about 15% of parcels, representing about 18% of unused soft-site capacity, are historically-designated.
”Soft sites” are defined here as parcels we think are more primed for redevelopment for various reasons. The data recipe includes properties that use one-third or less of their legal zoned capacity and have no more than 20,000 square feet of structure on them. It also includes vacant lots, parking lots, and auto-oriented commercial properties like strip malls and gas stations. BPN Property Intelligence has filters for high-confidence, medium-confidence, and low-confidence soft sites that we used for this analysis and some forthcoming ones.
At the Historical Commission, property rights can be more of a suggestion than a true right. The review process has a way of shrinking projects, even in some cases where the Commission only has review-and-comment authority, not actual legal authority to change the project under review. The absence of public data on units proposed in initial applications means we can’t measure this phenomenon right now, but it’s broadly the case that the legal capacity numbers are to some extent overstating the realizable square footage in the cases where that has to be negotiated.
Most Unused Capacity is on Sites with Buildings on Them
A somewhat related issue is that only about 1,290 parcels in Greater Center City are genuinely un-built, holding roughly 6.8 million square feet of unused capacity, The larger opportunity lies in under-built land, comprising about 17,500 parcels and some 130 million square feet of unused private capacity in the expanded study area.
In practical terms, this means converting unused capacity into new housing units will involve demolition more often than not, or adaptive reuse. That’s not a total blocker unless you’re in a historic district, but it does add cost and time and bureaucratic friction to the redevelopment process that a fully vacant parcel doesn’t have to contend with.
Under the circumstances, it still makes sense to try and find more ways to increase the amount of zoned capacity, particular on land unencumbered by historic districts or other policy headwinds like the Mixed-Income Neighborhoods (MIN) mandatory inclusionary zoning overlay in the 3rd and 7th Districts.
H.O.M.E. Parking Reforms Are Worth ~$1 Billion in Savings
One of the most interesting findings in our memo is about the impact of Bill 250524, which eliminated parking mandates on CMX-4 and CMX-5 parcels back in the spring of 2025.
Our analysis found that this policy change will save builders—and ultimately tenants—from having to build around 31,490 parking spaces, equivalent to roughly 11,000 square feet of built space.
At a low-ball estimate of around $30,000 per space, Center City developers and ultimately their tenants will avoid paying for nearly $1 billion in capital misallocation to parking. That’s real money and building space that can be devoted to building more housing on these sites instead.
The Real Capacity Play: Expanding Transit-Oriented Communities Stations
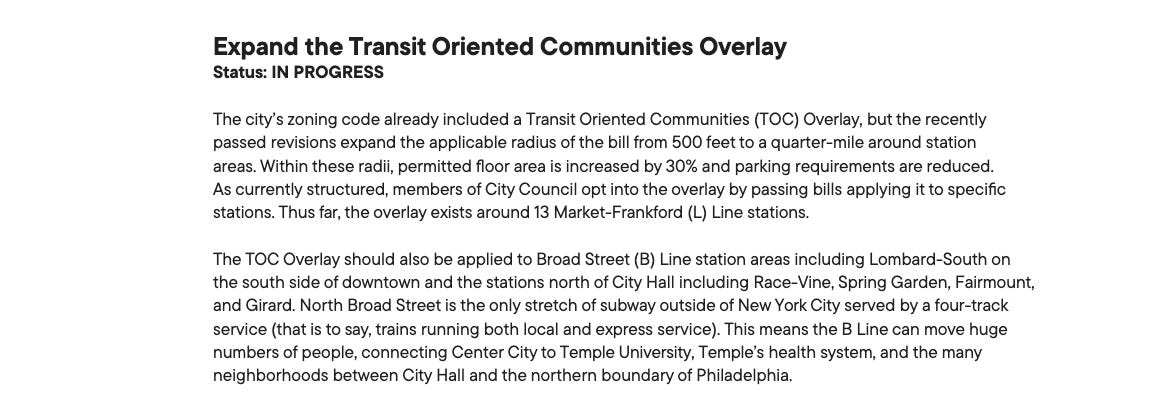
Another source of new zoned capacity could come from adding more SEPTA stations to the Transit-Oriented Communities ordinance beyond the 13 currently-designated L stations. Only one of these stations—Spring Garden—sits on the edge of CCD’s Greater Center City study area, and no other GCC stations have been added to the ordinance so far.
Center City District calls on City Council to add the Center City B stations to the roster, noting that TOC is only applied to the L today.
(Image: Center City Housing Report 2026 | Center City District)
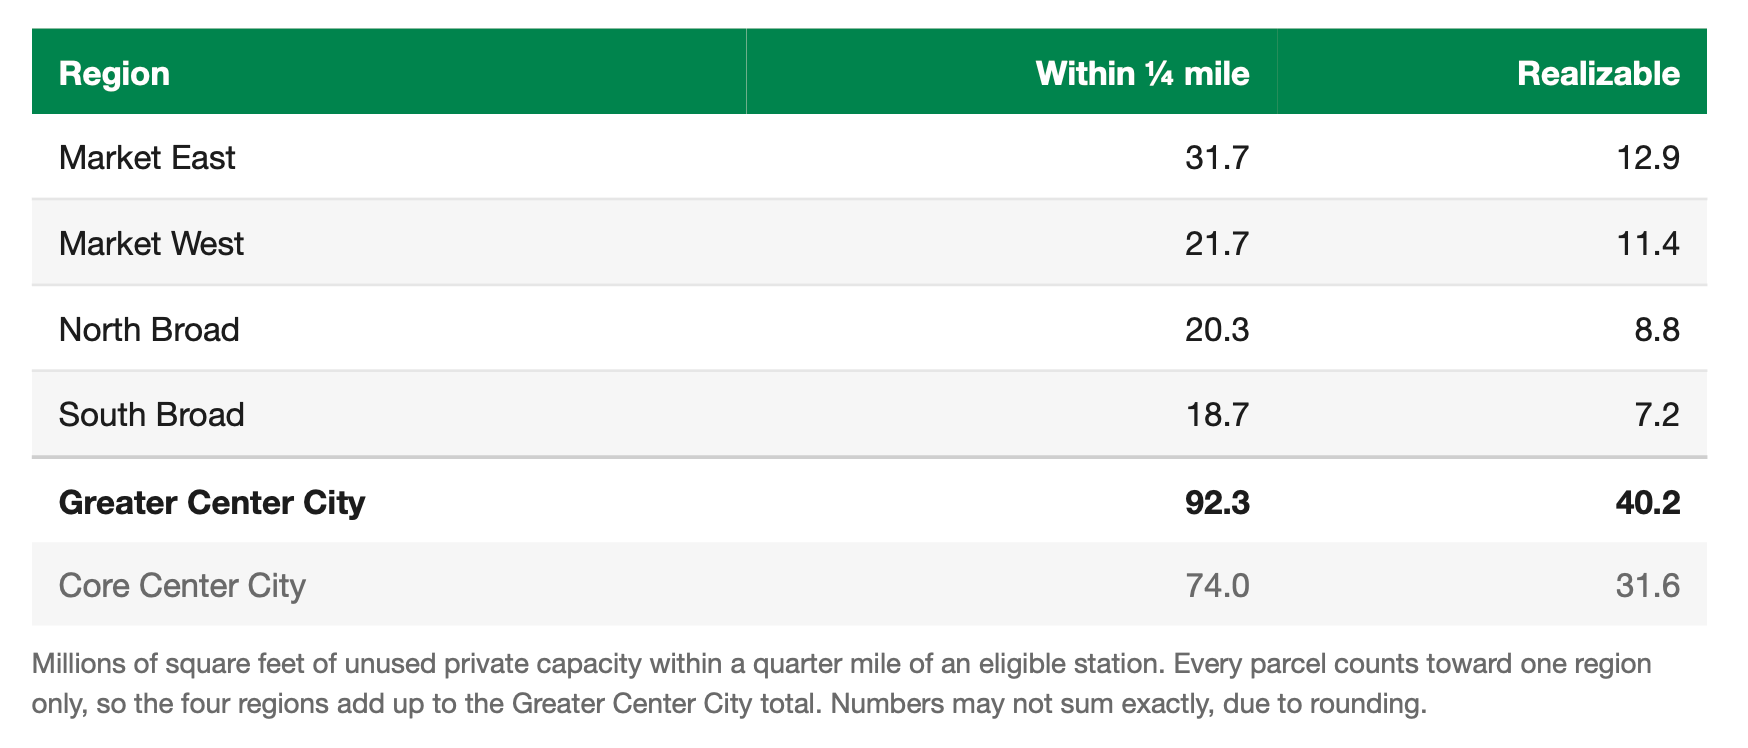
BPN’s memo looked at TOC expansion opportunities by region and by transit line to show where the most new capacity could be gained from designating new station clusters.
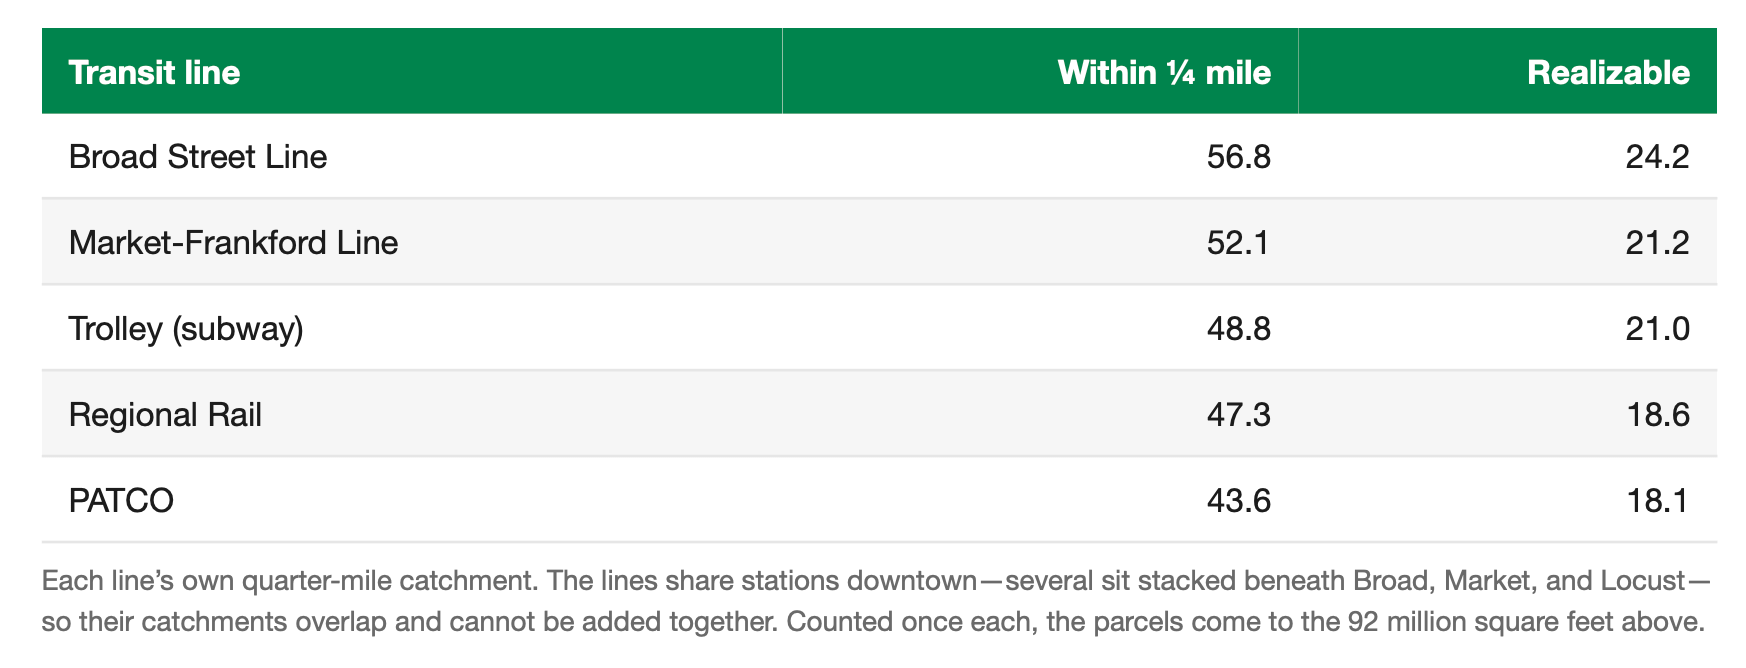
Designating only the Greater Center City B, L, and T stations could generate on the order of 40 million more square feet of realizable development on soft-sites near stations, with most of the gains coming from Market East and Market West. Because of the overlapping ¼ mile circles, there’s some double-counting involved in trying to break this out by regions. But the purpose of this exercise is more about revealing the rough magnitude difference between the different regions or lines for prioritization purposes.
287 Turn the Key-able City Lots in Greater Center City
The last section of the memo concerns opportunities for public land development in Greater Center City. After removing parks and civic landmarks from the list, we identified about 1,137 public parcels in the study area, of which 146 are located in the core Center City area.
There are about 287 rowhouse-sized city lots in Greater Center City, owned mostly by the Land Bank, the Redevelopment Authority, or the City of Philadelphia, that would be great candidates for Turn the Key workforce housing. This represents over a quarter of Mayor Parker and City Council’s adopted goal for the disposition of 1,000 city lots for housing, in an area with the strongest underwriting case.
We also identified around 474 land assemblage opportunities involving public land in Greater Center City that could be combined into larger contiguous parcels with the goal of facilitating larger developments with more units. Out of these, around 36 assemblage prospects involve just a single private counterparty, perhaps making these a lighter lift than others involving multiple private owners.
So far the city’s housing strategy as it relates to public land mainly involves Turn the Key for-sale homes on rowhouse-sized lots, but one of the big takeaways from CCD’s housing report is about the value of volume, and the sheer quantity of units that high-rise buildings can contribute on a very small land area.
The city’s 30,000 homes goal is not some unachievable pipe dream or campaign talking point. At least, it doesn’t have to be. The per-station capacity numbers for some individual stations show that there are tens of thousands of potential housing units to be gained from designating more transit stations for TOC, especially in Center City and other strong-market areas.
A few examples:
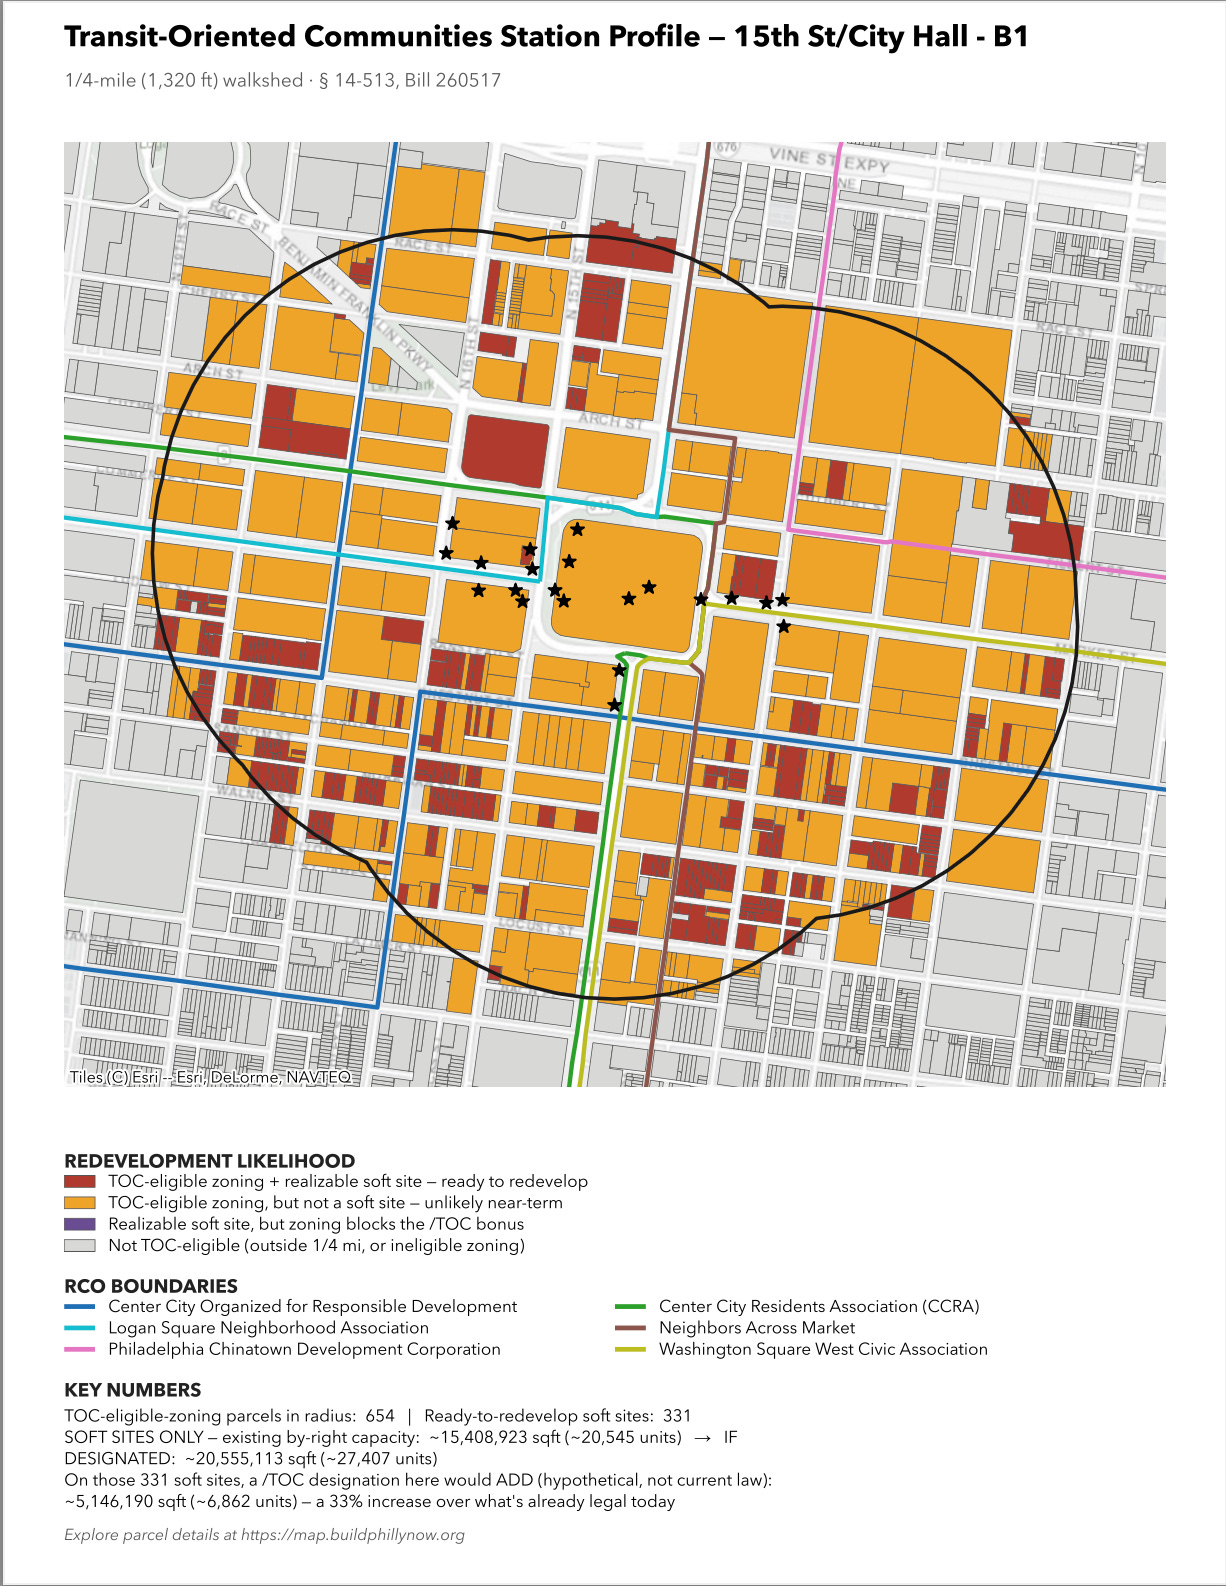
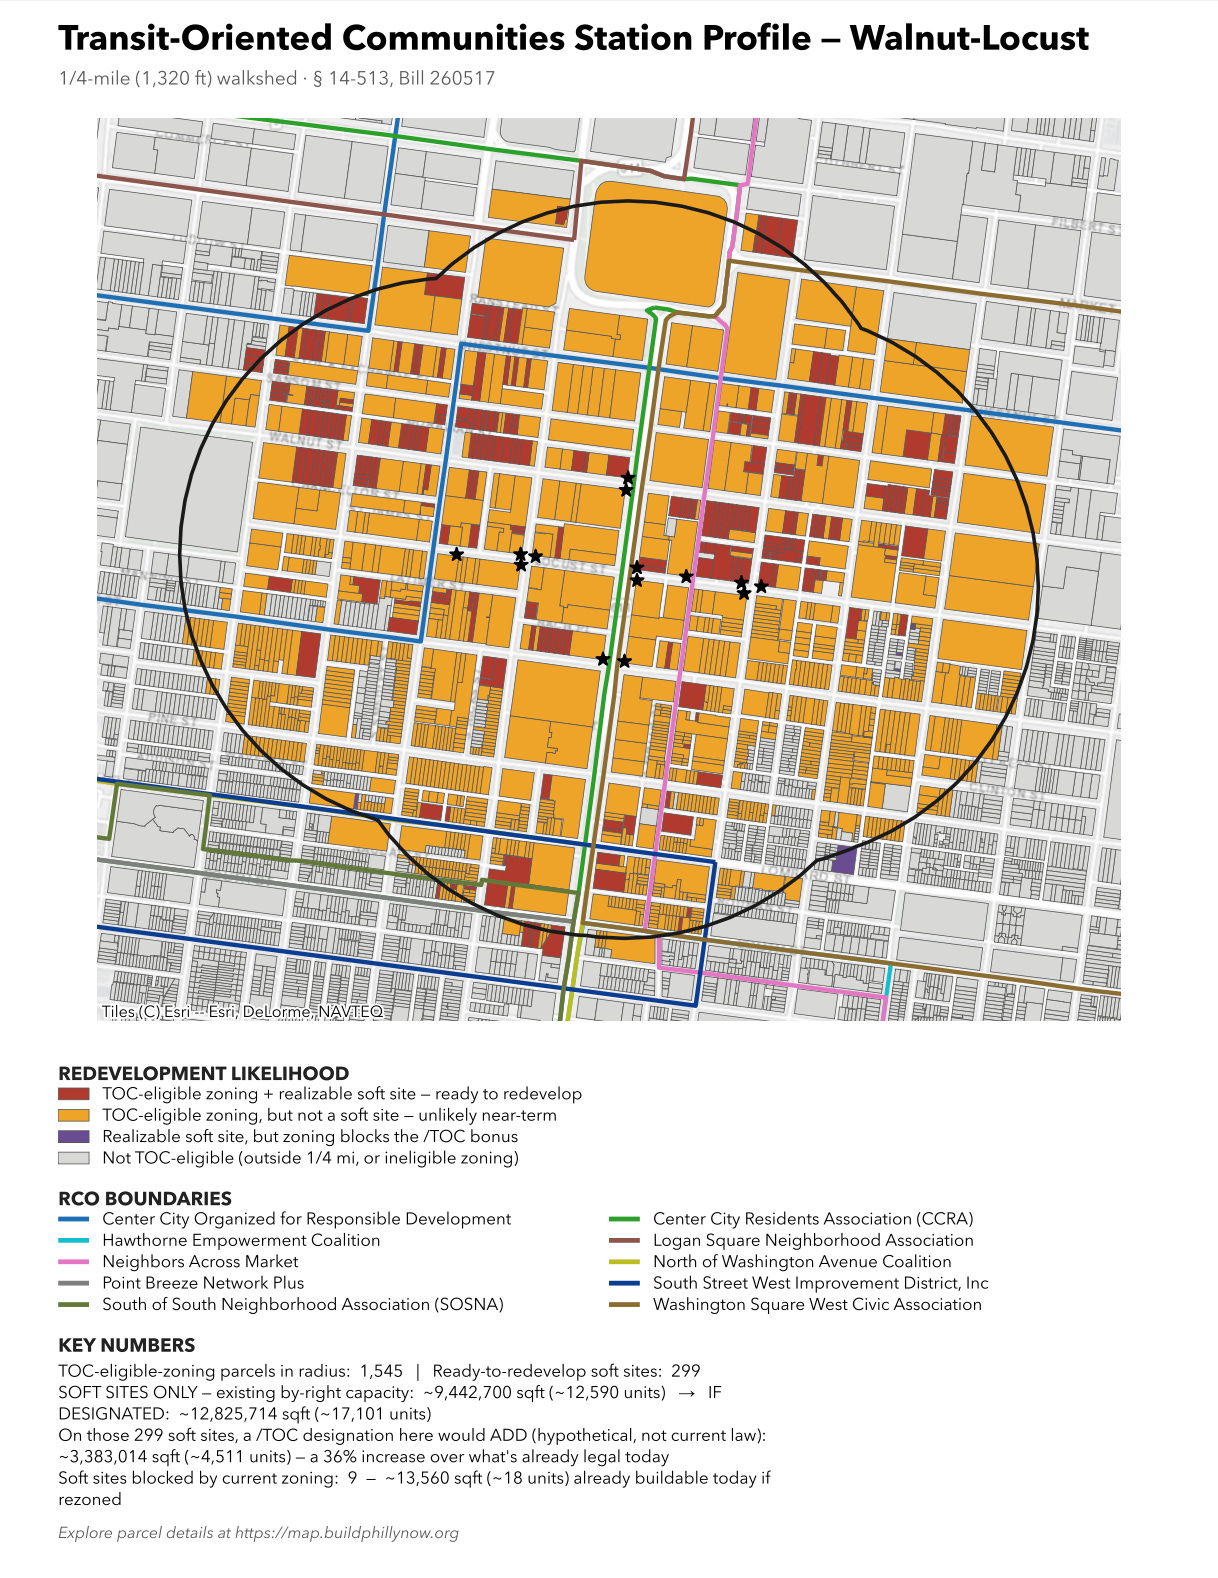
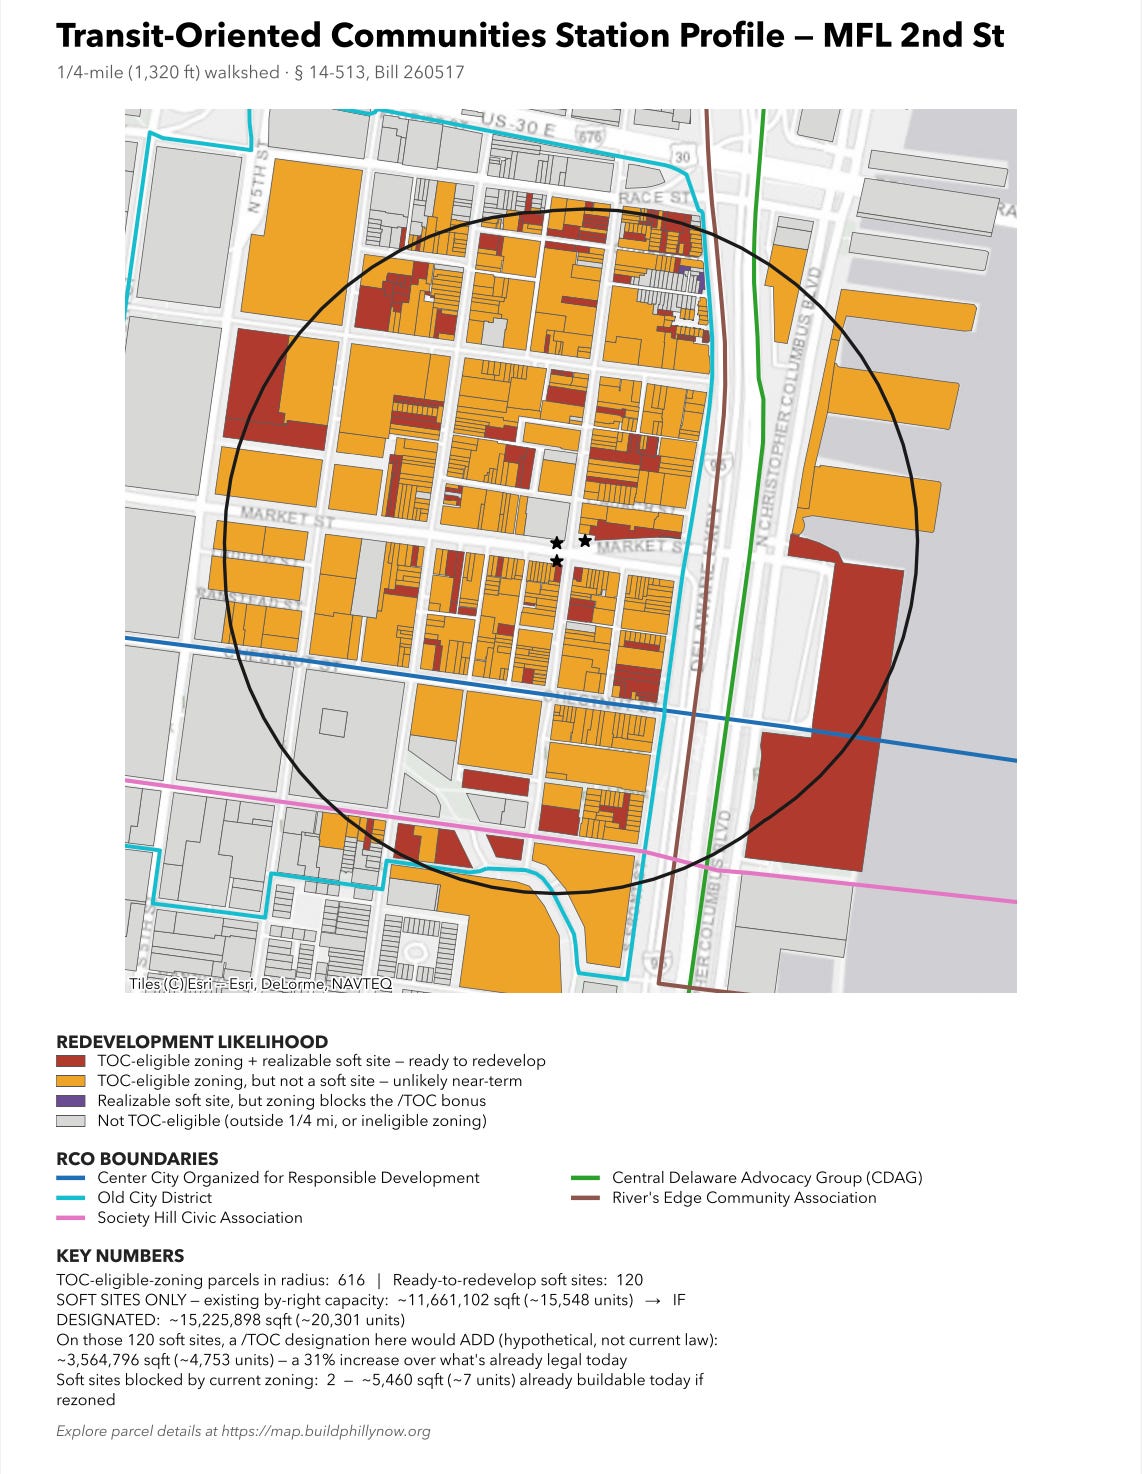
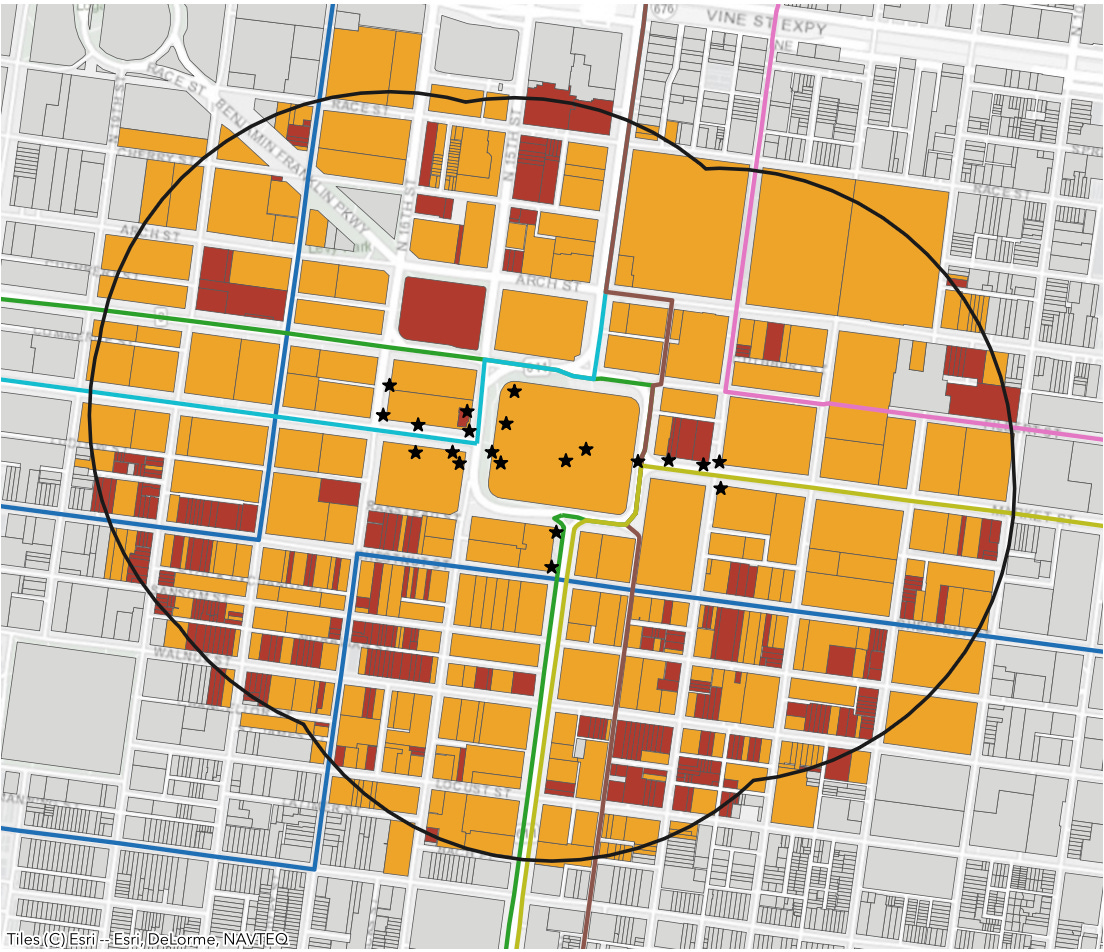
These three stations—15th St, Walnut-Locust, and 2nd Street, chosen totally at random from some fact sheets I made for a few neighborhood orgs—would add capacity for over 16,000 housing units in the high-opportunity core downtown area, where there’s no displacement downside to worry about. These all come from the soft- site parcels highlighted in red that are both more redevelopable, and have the requisite zoning for TOC.
Philadelphia has many excellent opportunities to add significant housing capacity on a small share of city lots, in the places with the transportation infrastructure to support many more residents. City Hall has taken commendable actions to create a better framework for achieving this with the two rounds of H.O.M.E. zoning bills, and now the time is ripe to build on this work by opting in more places.
BPN is preparing to launch the Professional membership tier of BPN Property Intelligence soon, where you can analyze build-ability and capacity data, and model financial feasibility for market-rate and LIHTC deals involving one or more parcels. For a free demo, email jon@buildphillynow.org.